Understanding the Current Landscape
Recognizing the growth of STEM service-learning courses since 2010, the CSU research team wanted to understand what these courses look like. To understand this landscape the research team examined the following questions, followed by our findings below:
How is service learning in STEM being implemented, given the vast range of interpretations of service learning?
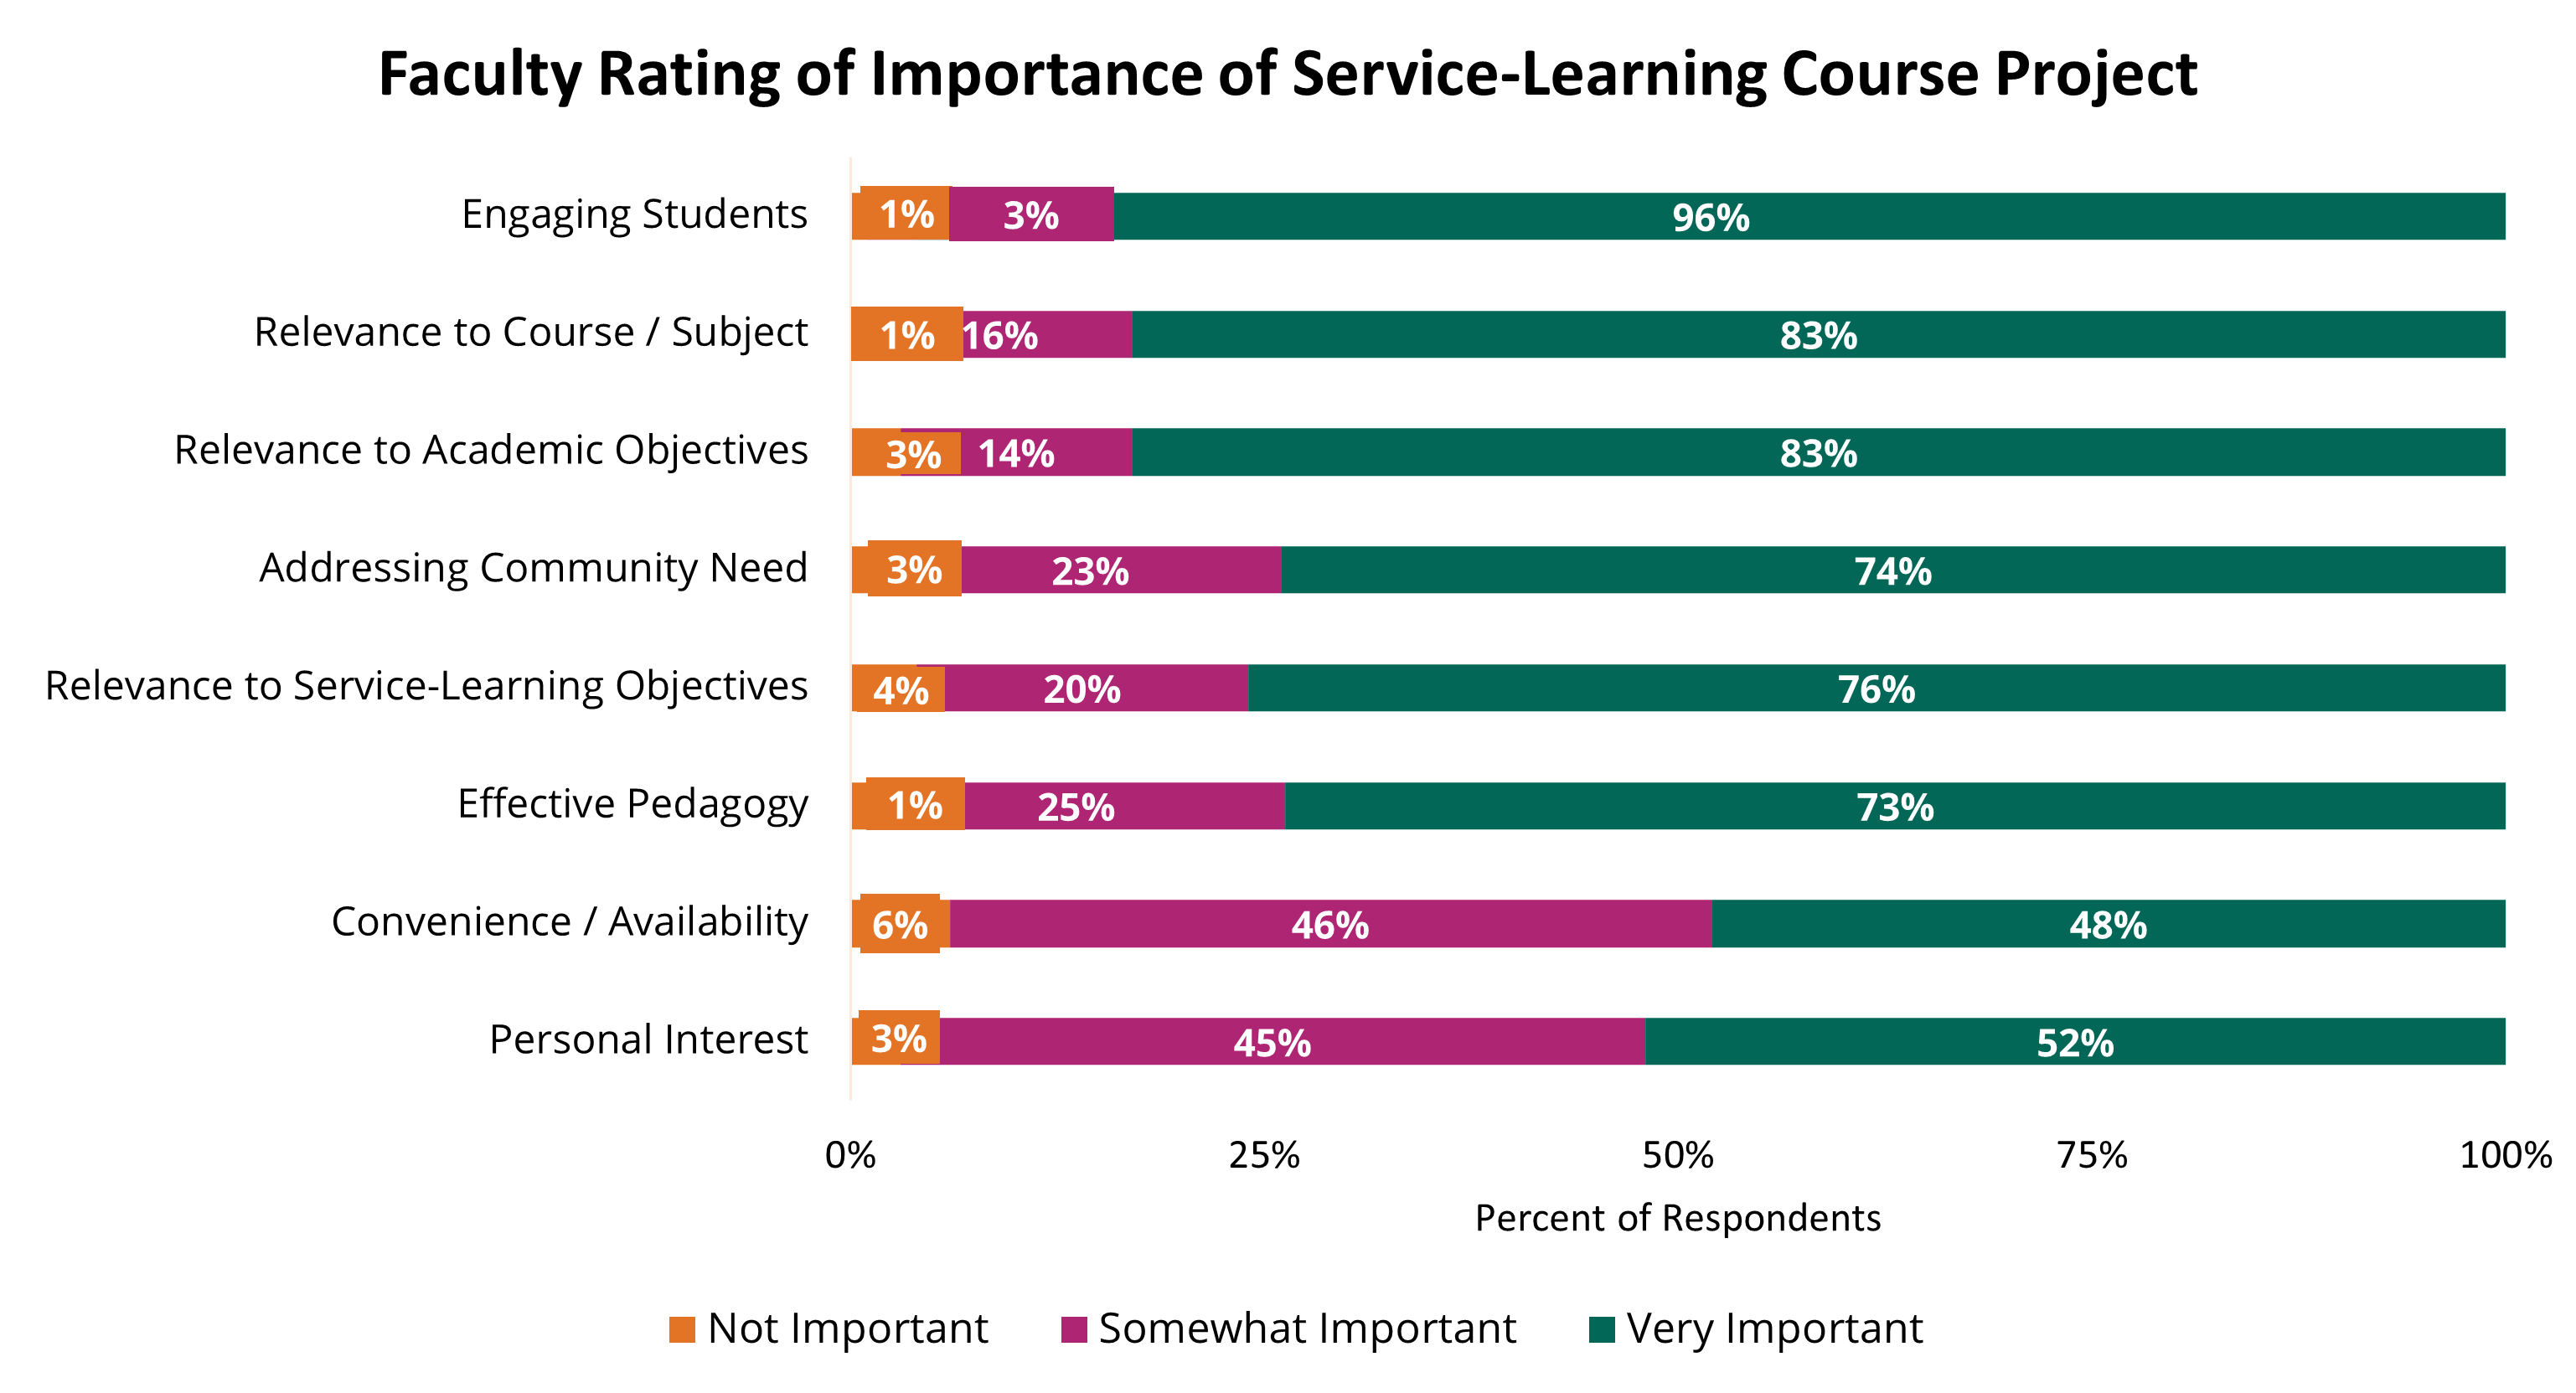
Survey results suggest that faculty members viewed “Engaging Students” as the most important factor while “Personal Interest” and “Convenience / Availability” was rated as least important across the three years.
What kinds of student learning and developmental outcomes did faculty expect the SL experience to enhance?
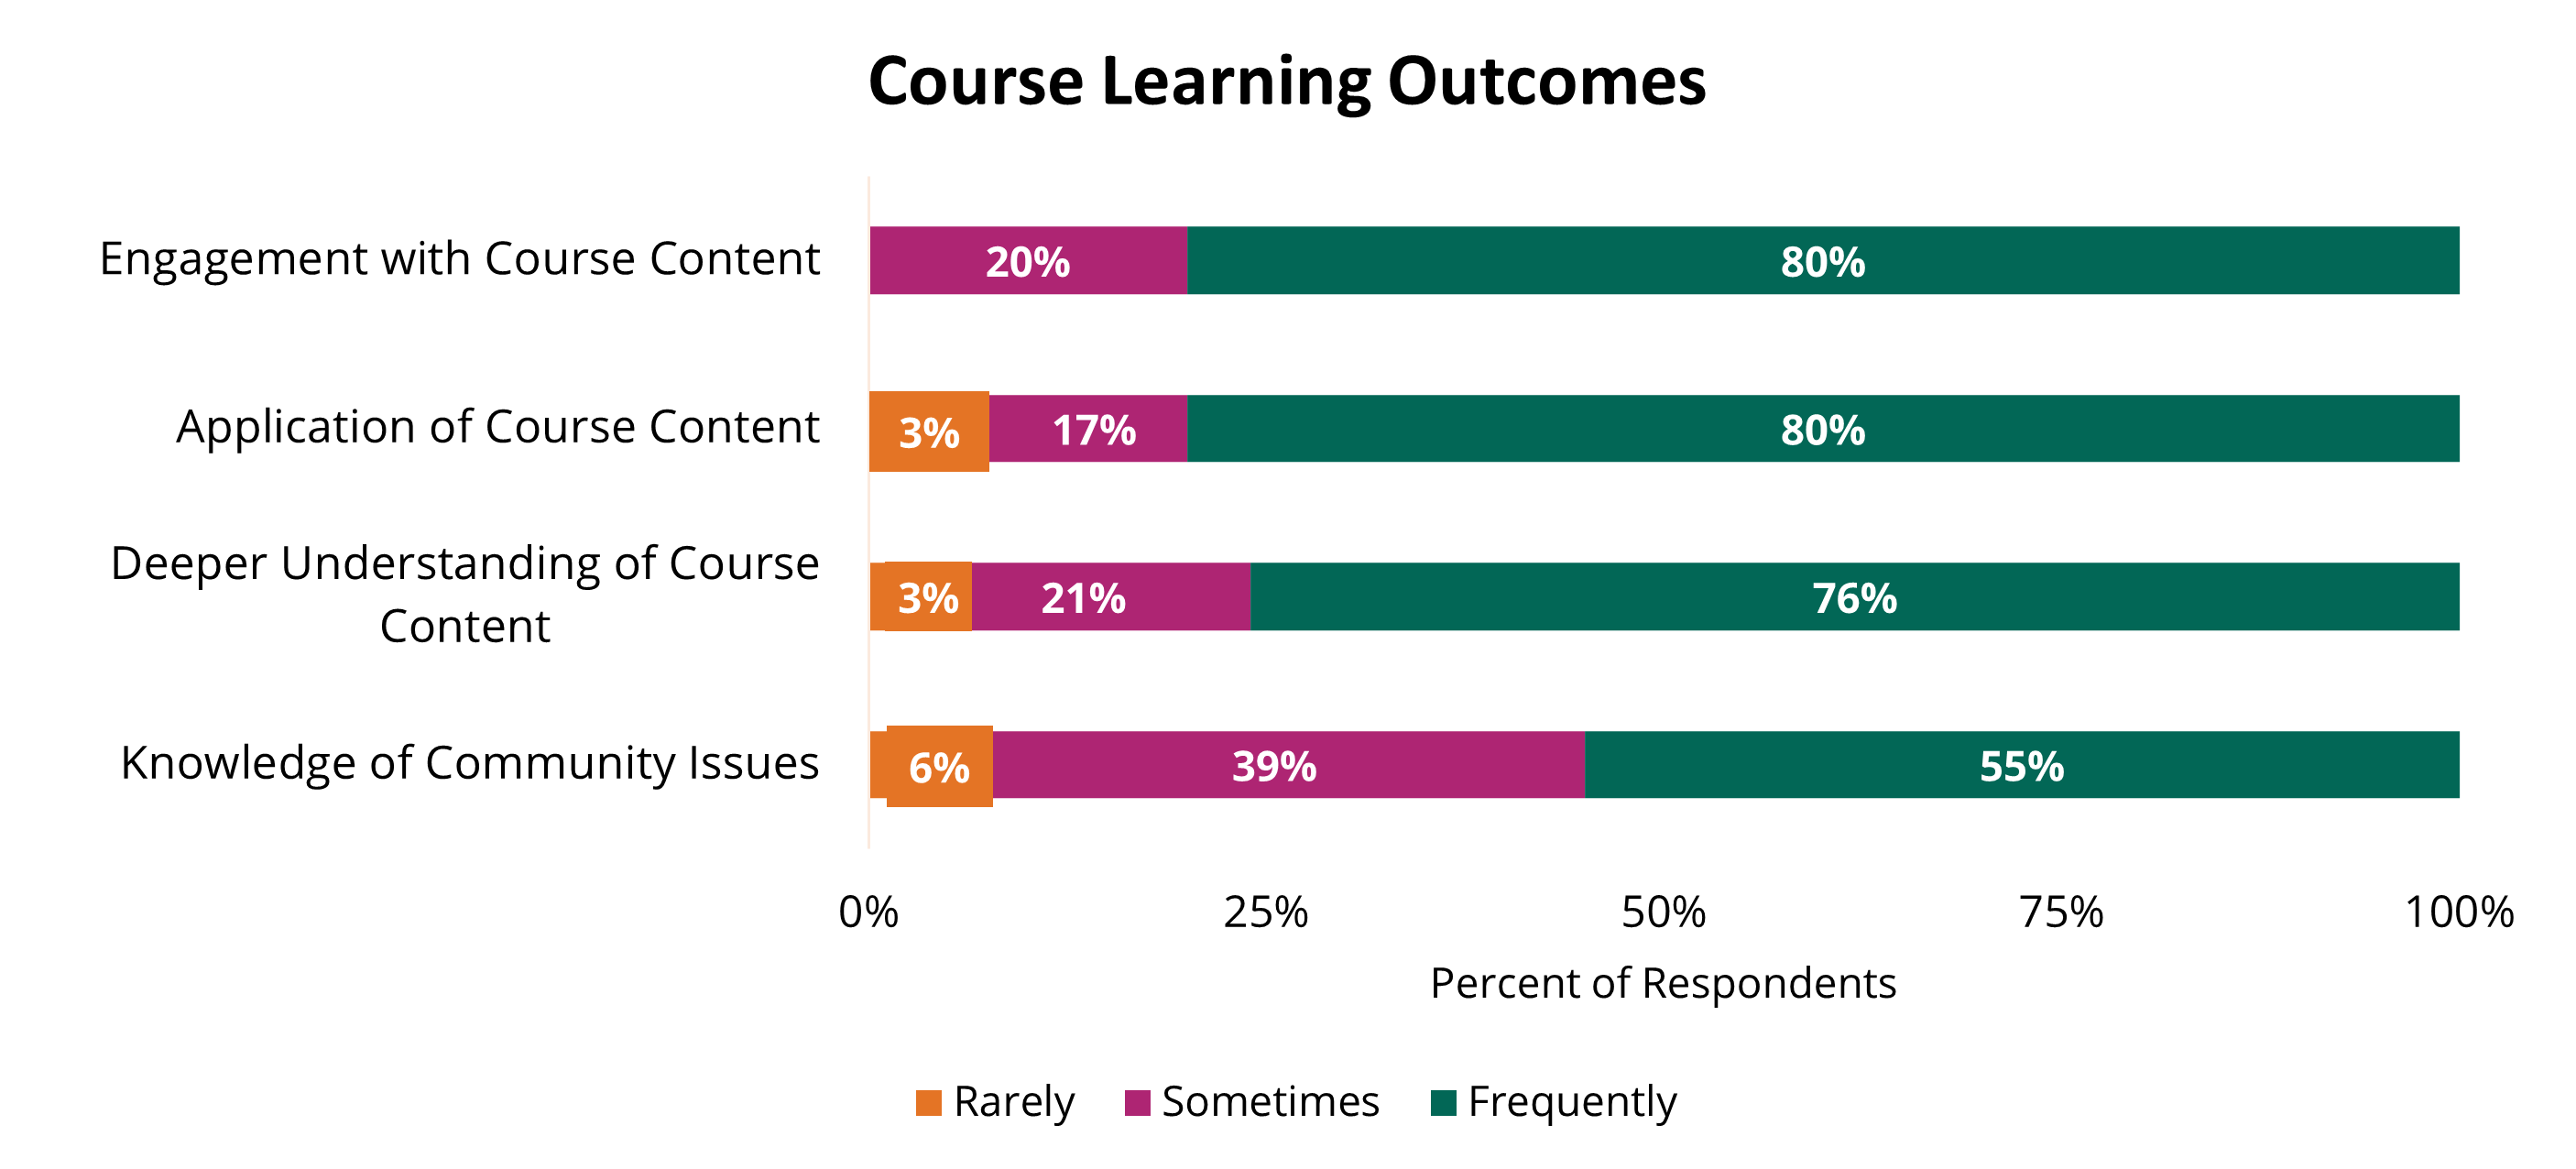
Faculty members were also asked to indicate the kinds of student learning and developmental outcomes they expected the service-learning experience to enhance. Faculty members indicated that they expected Engagement with Course Content to occur most frequently and Knowledge of Community Issues to occur less often.
Faculty rated changes in their pedagogy from the beginning to the end of the course using a 5-point scale (1 = Strongly Disagree to 5 = Strongly Agree). Faculty members indicated that they saw the biggest increase in their Understanding of Community Needs and Issues (M = 4.5, SD = .87), while the smallest increase was observed in their Research Interests Broadening (M = 4.18, SD = .92). A possible explanation for these results may be that faculty were focused on broadening their knowledge and understanding of SL-specific content rather than increasing knowledge in their research.
What are the common underlying elements in service learning implementation?
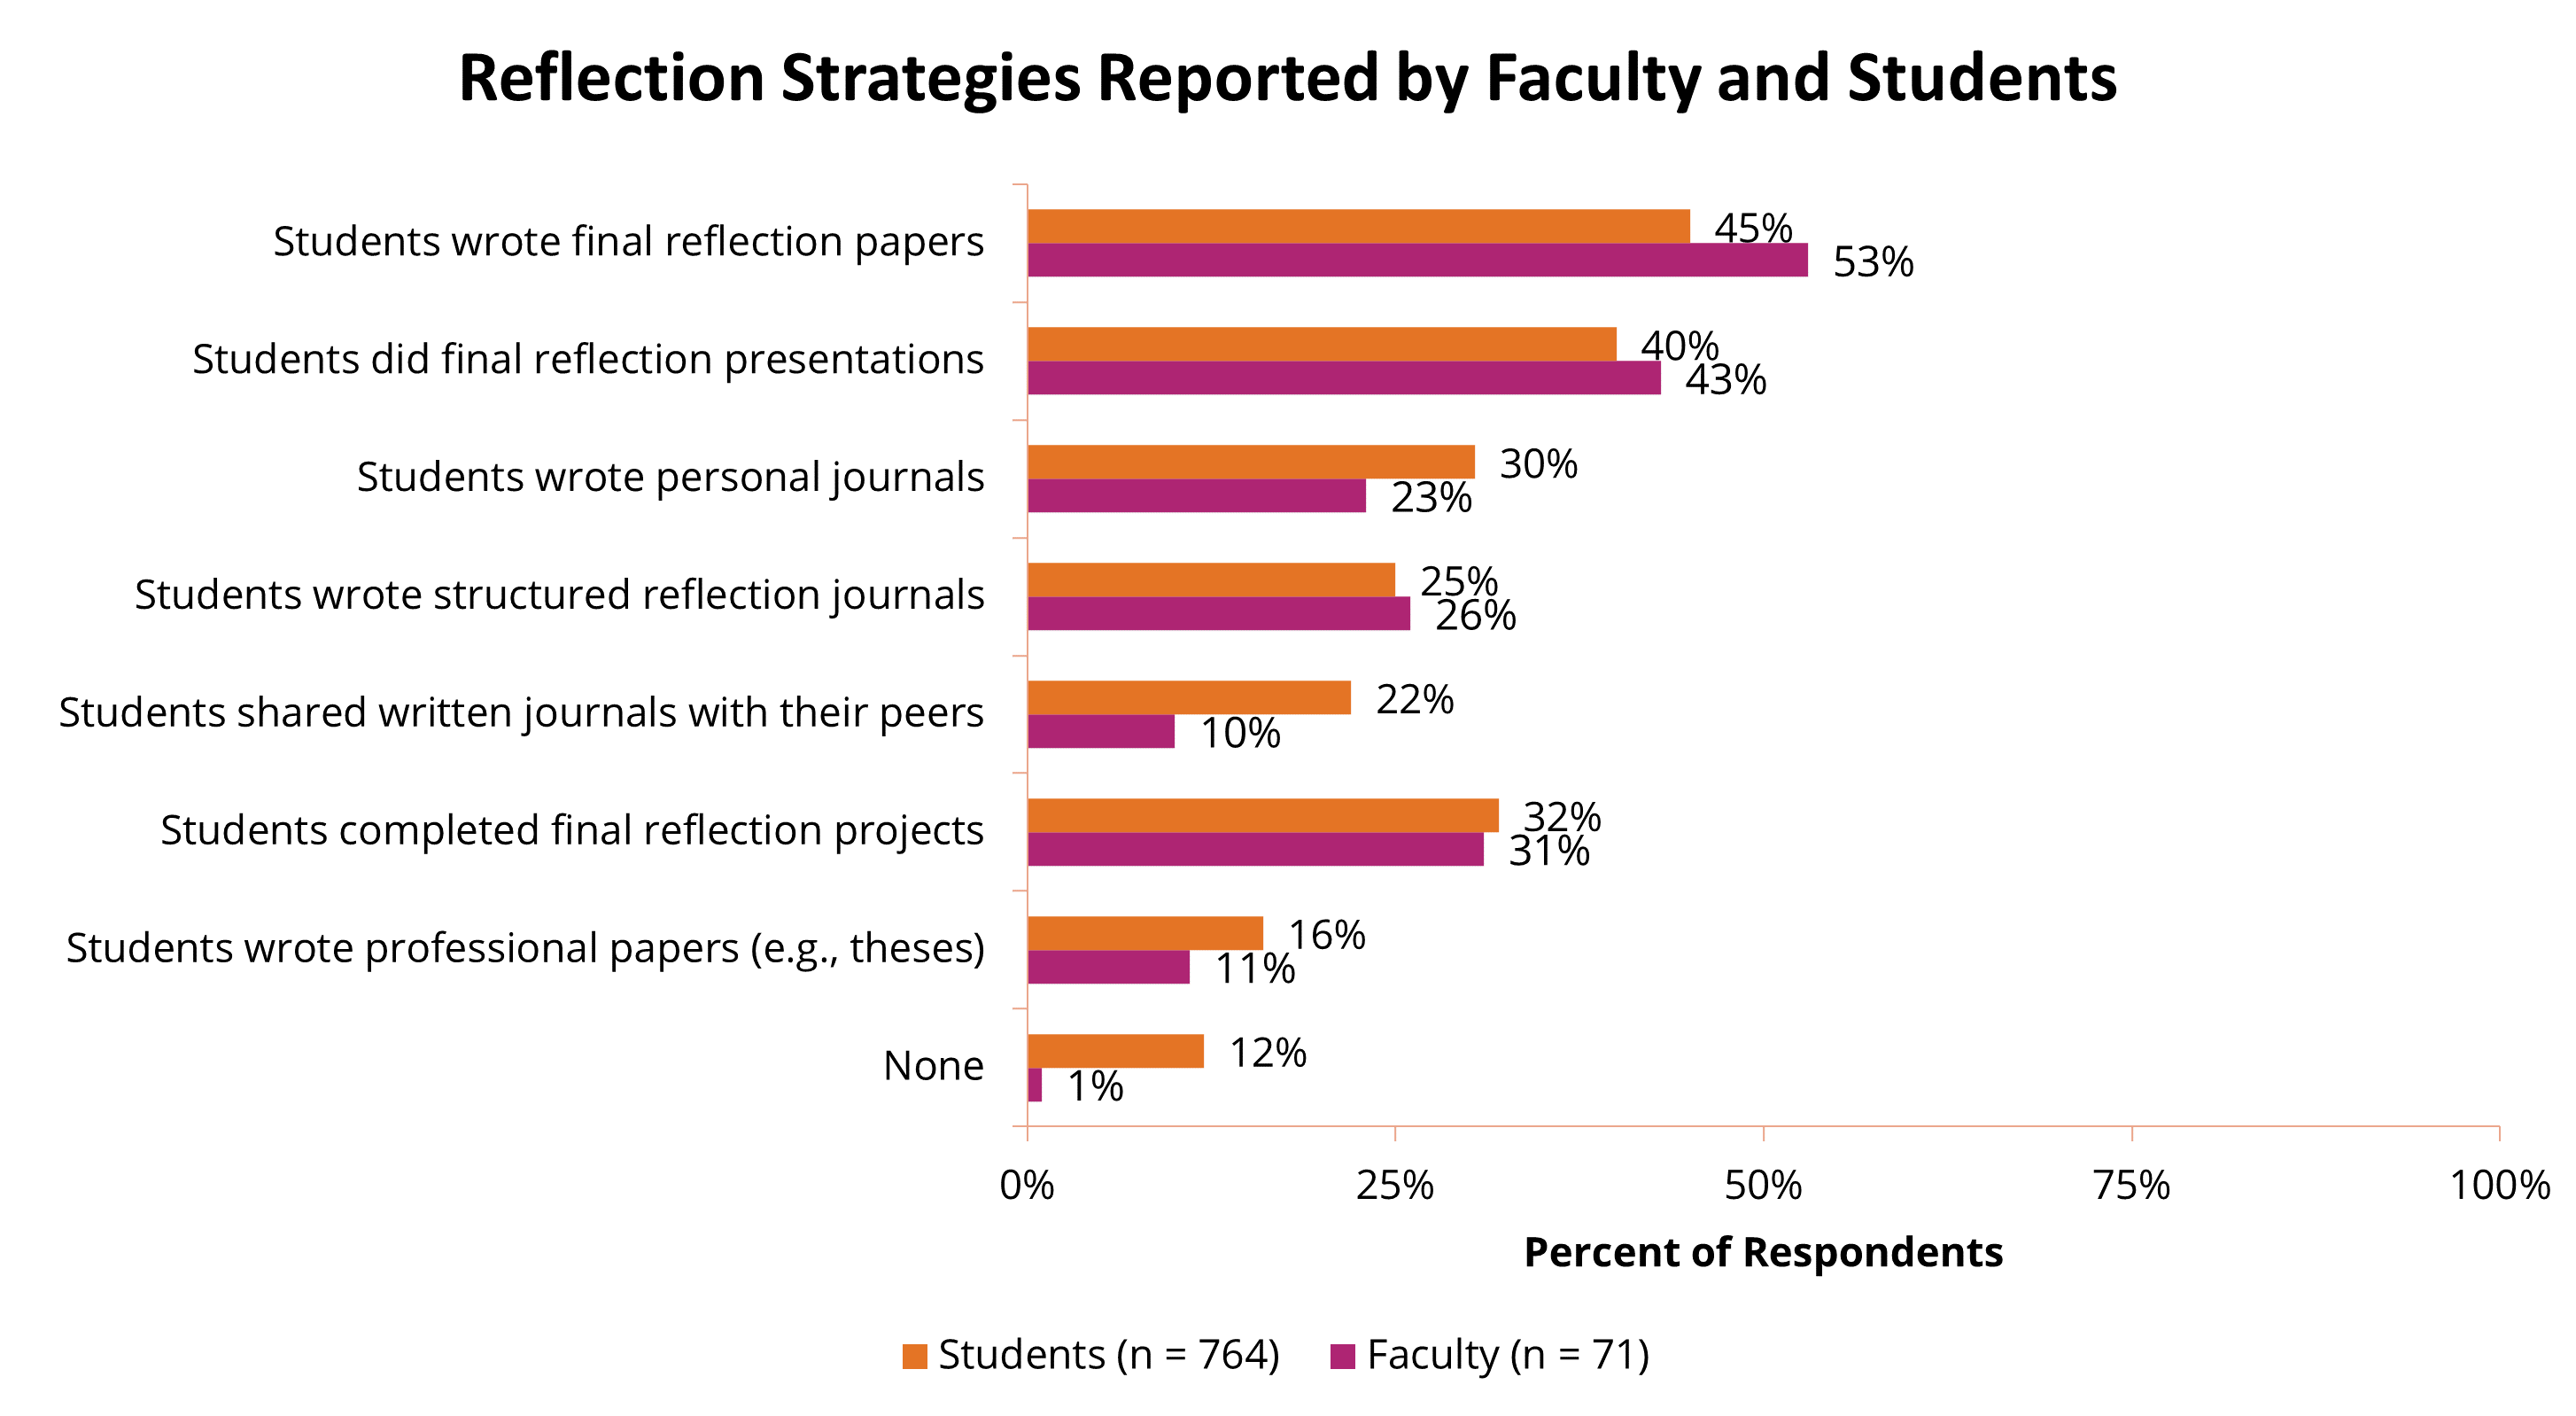
Both students and faculty members indicated how they implemented or participated in reflection strategies in their service-learning courses. Half (53%) of the faculty clusters reported implementing reflection by having students write a final reflection paper, while 45% of students reported completing this reflection activity. One noteworthy finding is that students shared written journals with their peers about twice as often (22%) and faculty estimated that they did (10%). Although faculty and student reports of reflection strategies varied slightly, in general, faculty members and students provided consistent information about the course on surveys.
To what degree are the essential elements of high-quality service learning present in participating courses?
Participating faculty members were asked to submit a copy of their service-learning course syllabus to the research team at the beginning of the academic term. Each syllabus was coded on the nine key dimensions identified by Heffernan (2001), on a scale of 0 to 4, with 0 indicating that the dimension was absent from the syllabus and 4 indicating the component was described as Exceptional in the syllabus. Each syllabus was then given an average score, which represents the overall quality of the syllabus as it relates to service learning.
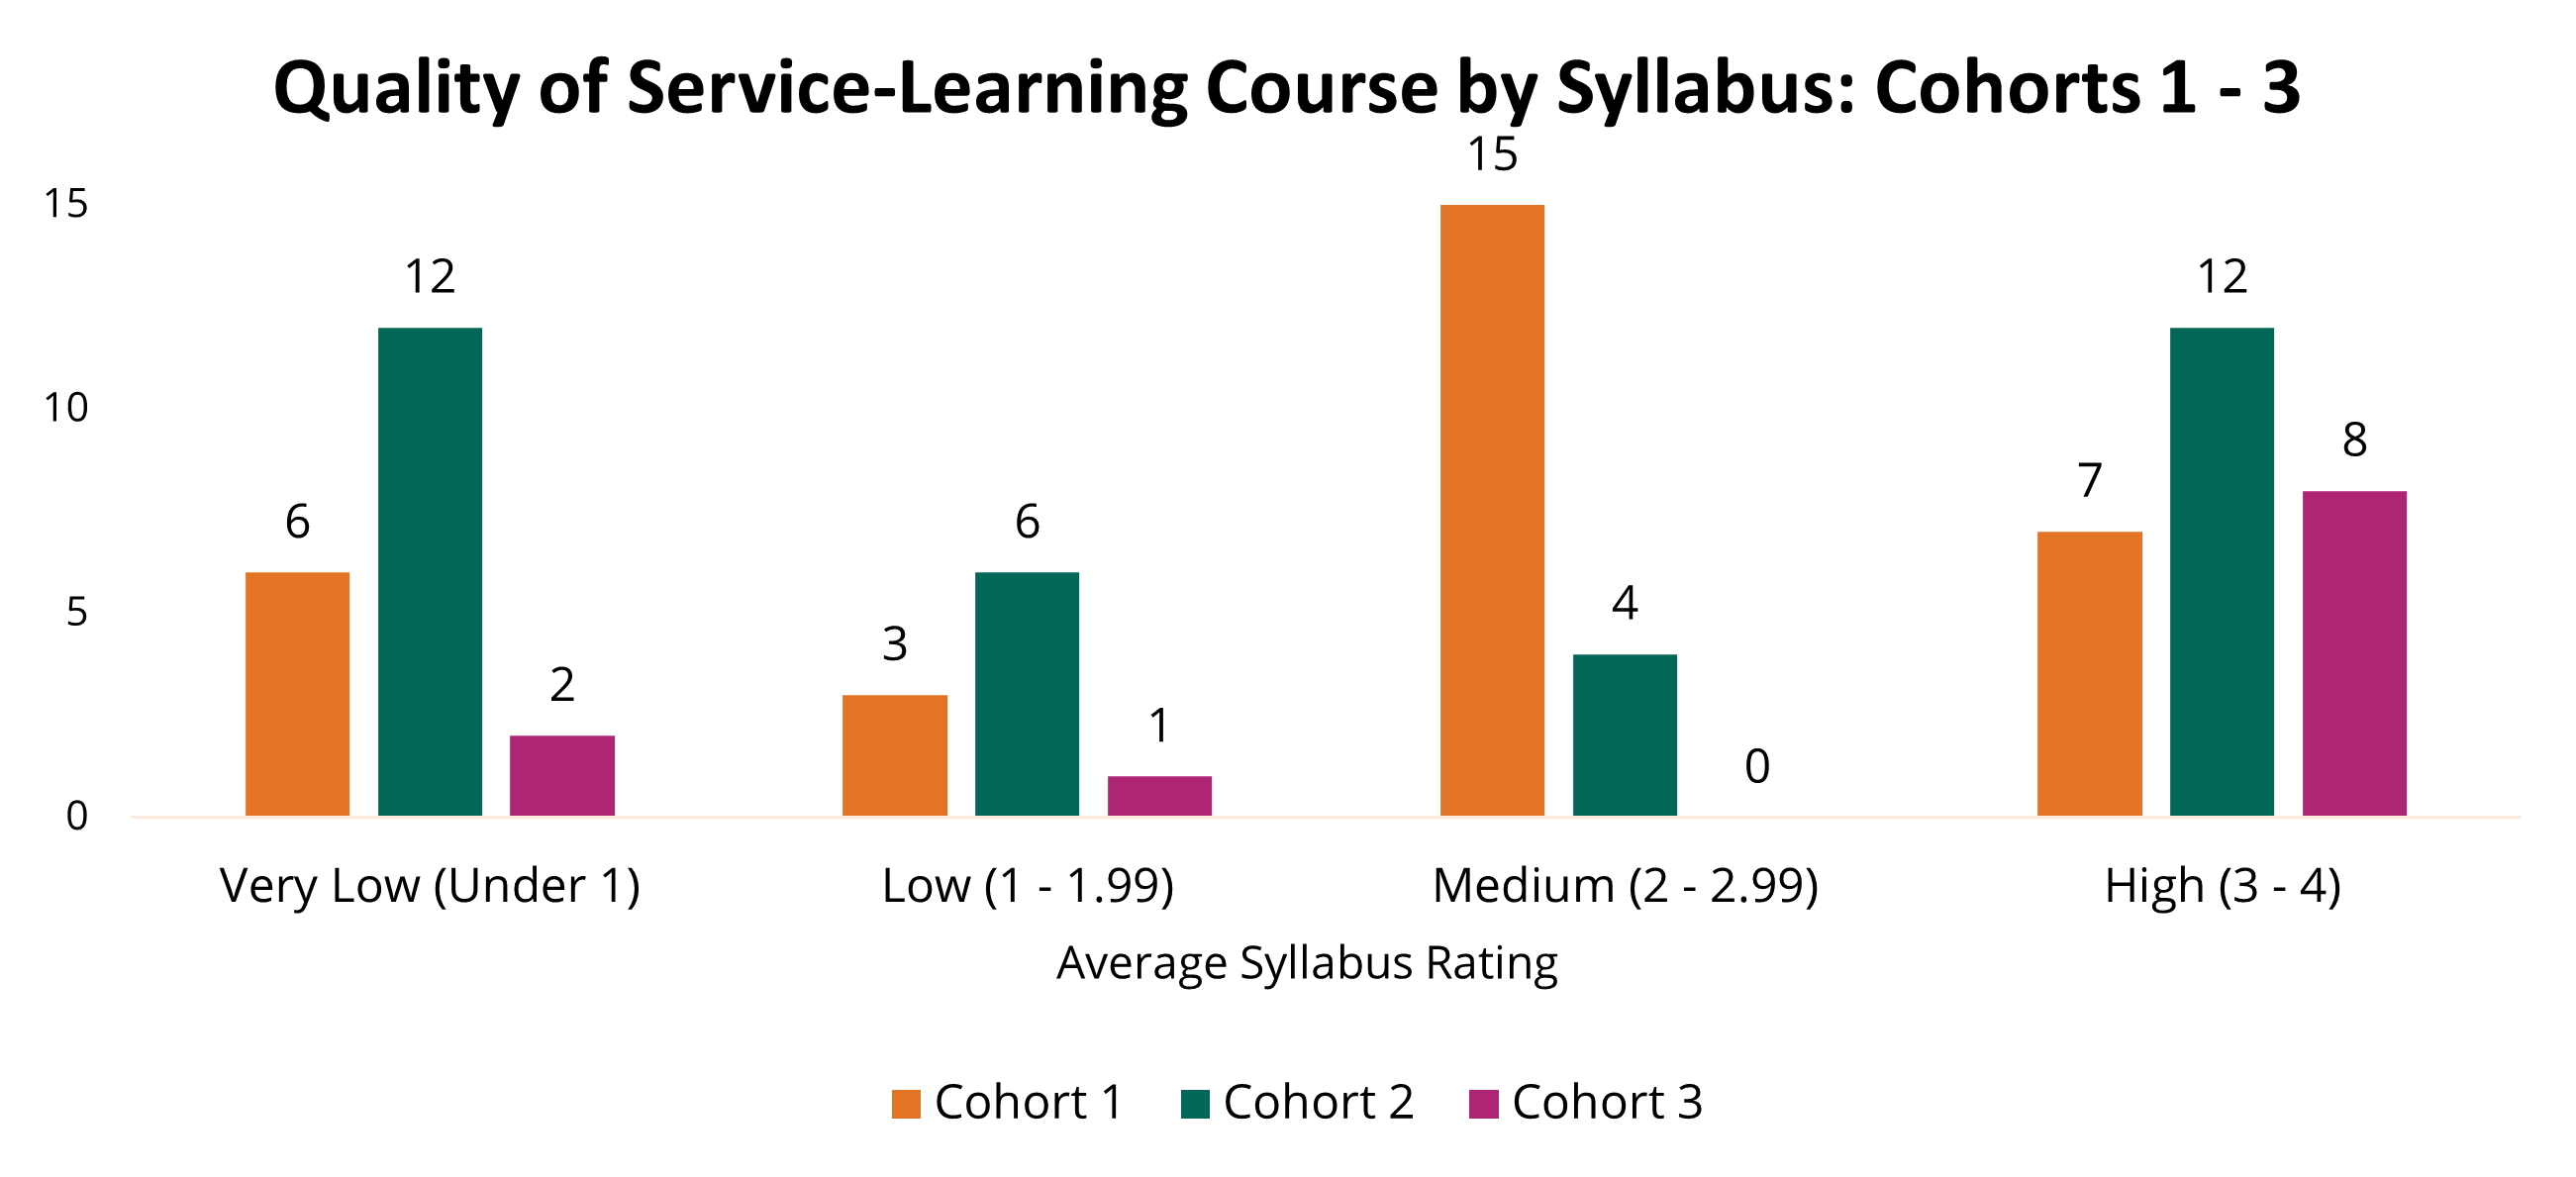
These scores were then assigned one of the following quality ratings: 1) very low, 2) low, 3) medium, and 4) high. As shown in Figure 7, only 35% of syllabuses were rated as high-quality syllabuses, meaning that they included most key dimensions of a SL syllabus. Roughly 40%, however, were rated as very low or low-quality.
Quality of Service Learning Course By Student Ratings
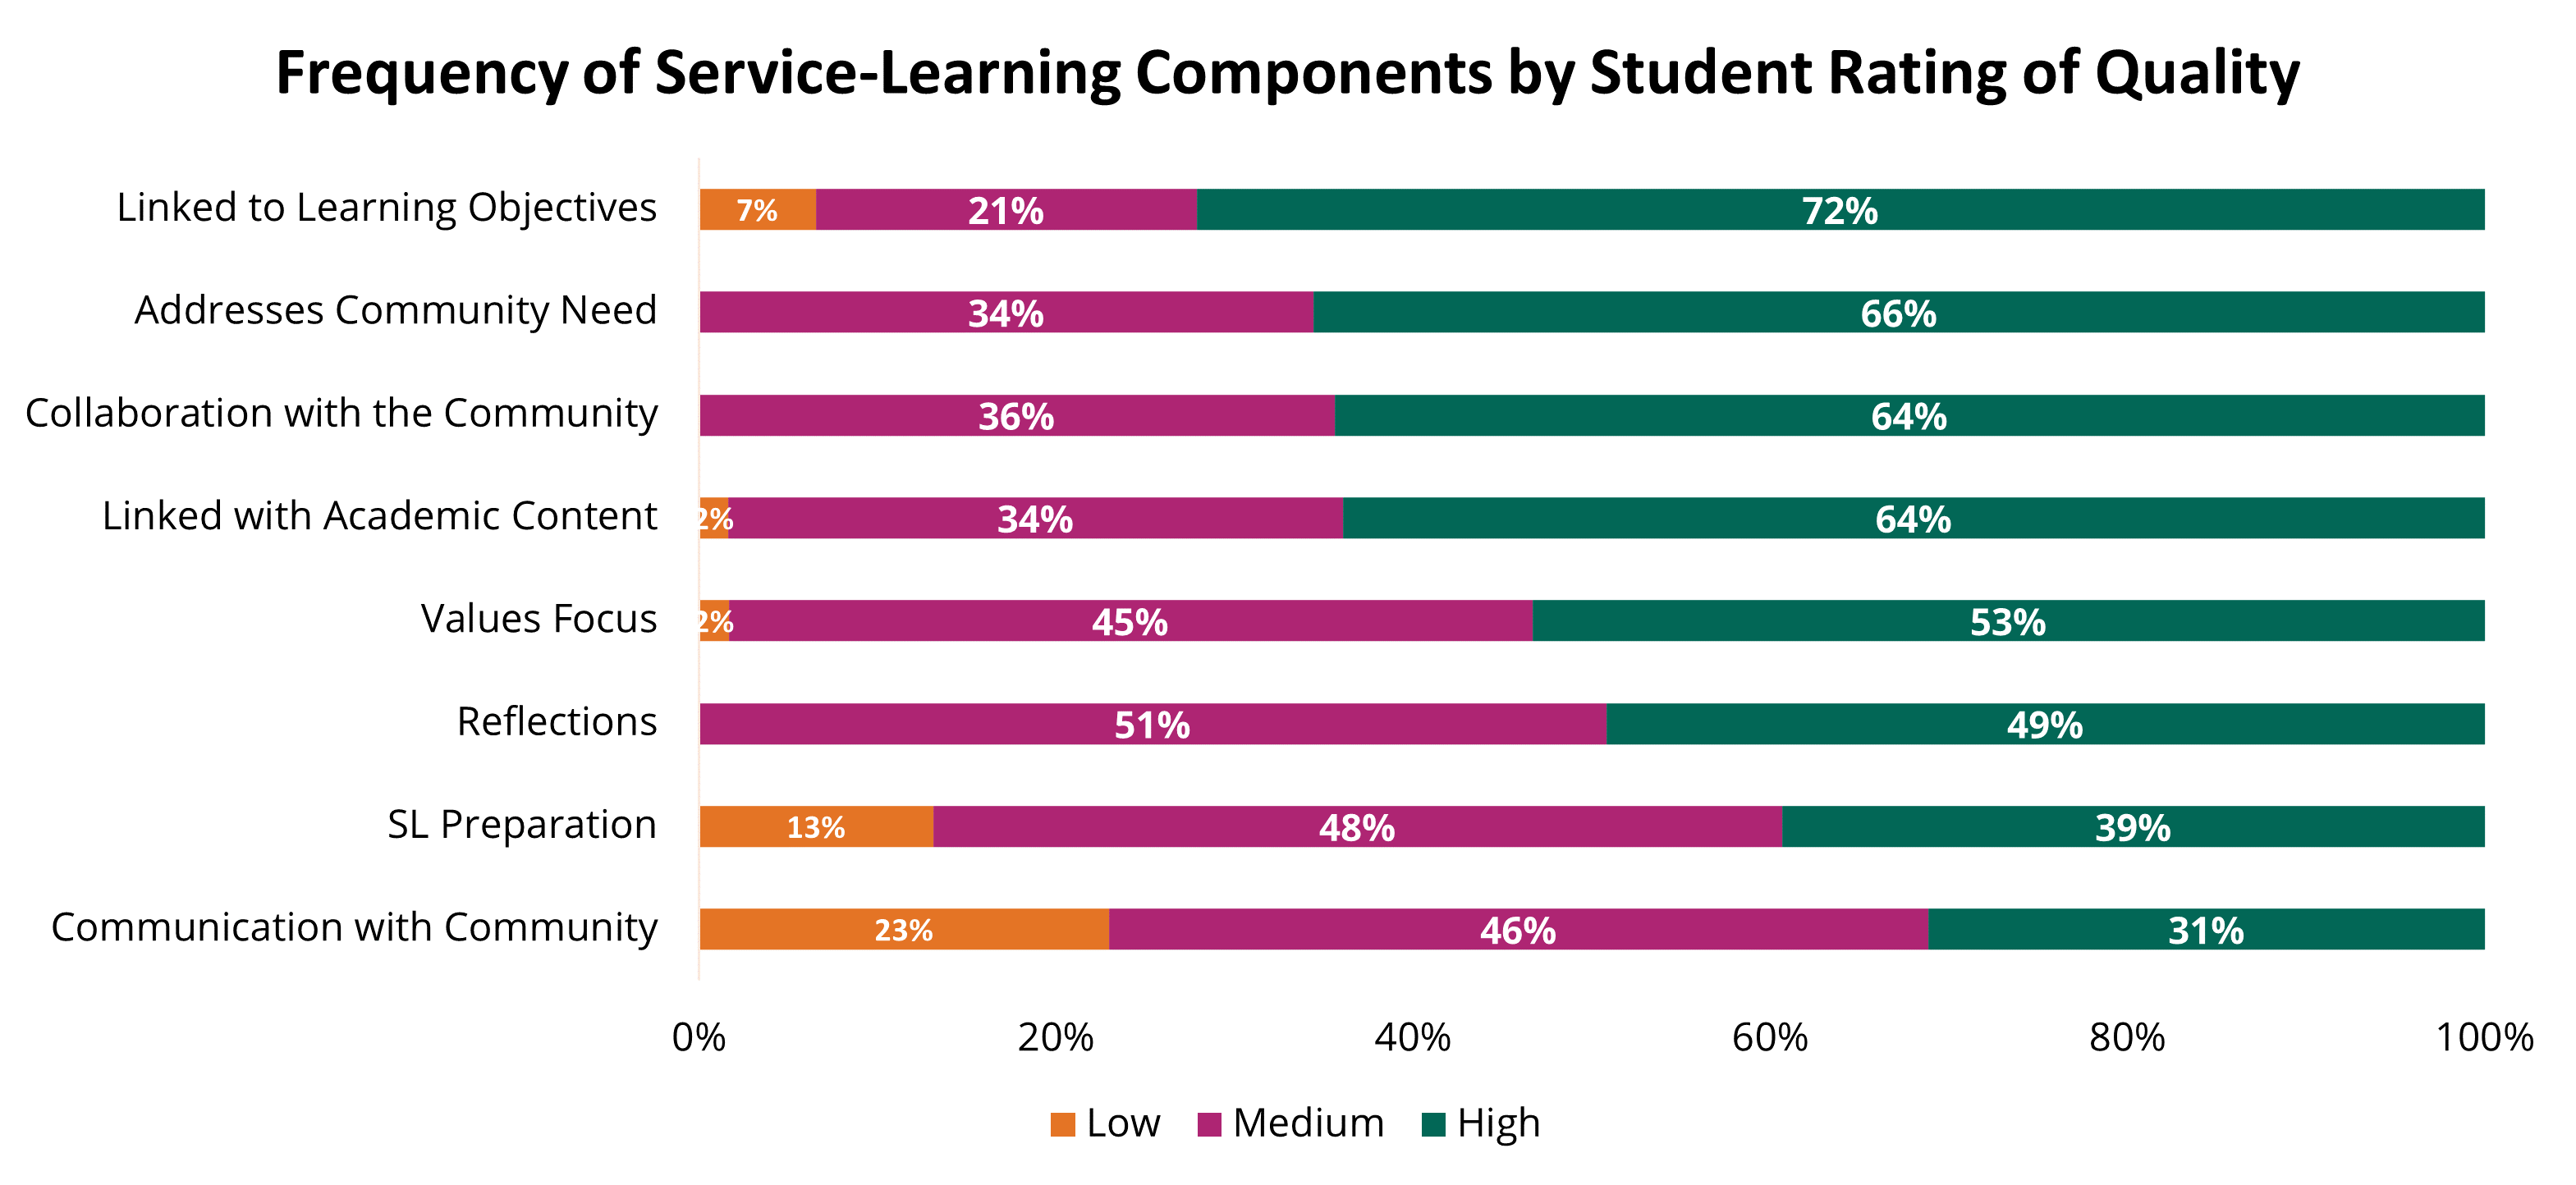
The research team analyzed the student scores of the identified service-learning components by cluster to explore student experiences by course. The average cluster score for each component was assigned a quality rating of either low, medium, or high based on the average student rating. Initial analyses reveal that, in general, students rated the quality of Addressing Community Need, Linked to Learning Objectives, Collaboration with the Community, and Linked with Academic Content as high. The service-learning components with the lowest quality ratings were Communication with the Community and SL Preparation. Appendix G provides the analysis of these quality ratings by year.
Predicting Civic Engagement Attitudes and Behaviors and STEM Career Attitudes
Students in the high-quality clusters reported, on average, significantly more positive civic engagement attitudes and behaviors than students in the low quality clusters.
Comparison of Mean Student-Reported Civic Engagement Attitudes, Civic Engagement Behaviors, and STEM Career Interest by
Service-Learning Clusters Based on Assigned Quality of Service-Learning Experience (Low, Medium, High)
| | Low Quality
(n = 296)
| Medium Quality
(n = 213) | Hight Quality
(n = 215) | F (df)
|
|---|
| Civic Engagement Attitudes | 5.44a | 5.56 | 5.77a | 2.91
(2,178)+ |
| Civic Engagement Behaviors | 4.58b | 4.81 | 4.92b | 2.88
(2,718)+ |
| STEM Career Interest | 4.09 | 4.06 | 4.15 | 0.72
(2,722)+ |
Note: (+) Indicates a marginally significant result; means with superscripts (i.e., a,b) indicate that pair-wise comparisons are significantly different from each other. a:p<.01; b:p<.05.