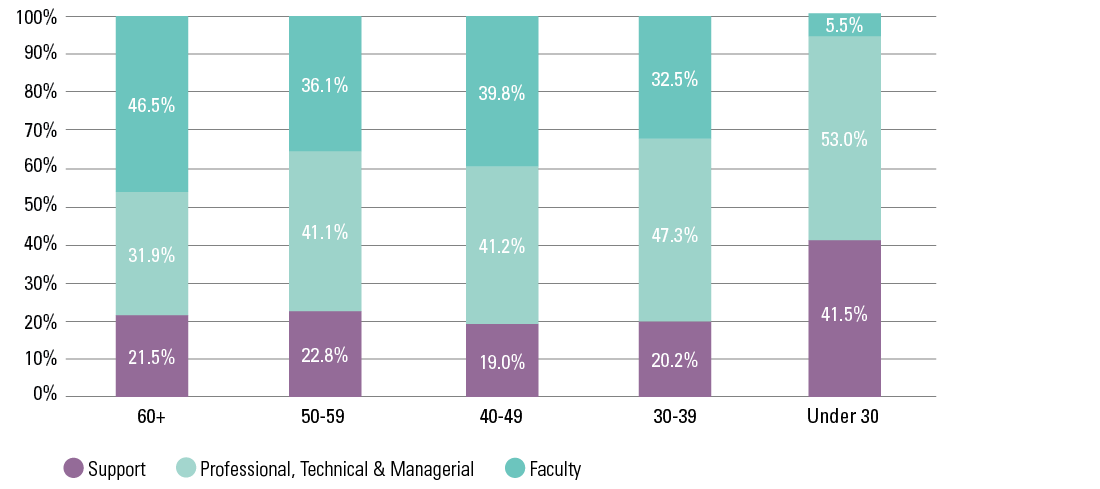
60+
| 21.5% | 31.9% | 46.5% |
50 - 59
| 22.8% | 41.1% | 36.1% |
40 - 49
| 19.0% | 41.2% | 39.8% |
30 - 39
| 20.2% | 47.3%
| 32.5% |
Under 30
| 41.5% | 53.0% | 5.5%
|
*Support includes persons in the following employee categories: Construction/Maintenance/Transportation, Office/Administrative Support and Service Occupations.
**Professional, Technical & Managerial includes persons in the following employee categories: Management and Professional/Technical Occupations.