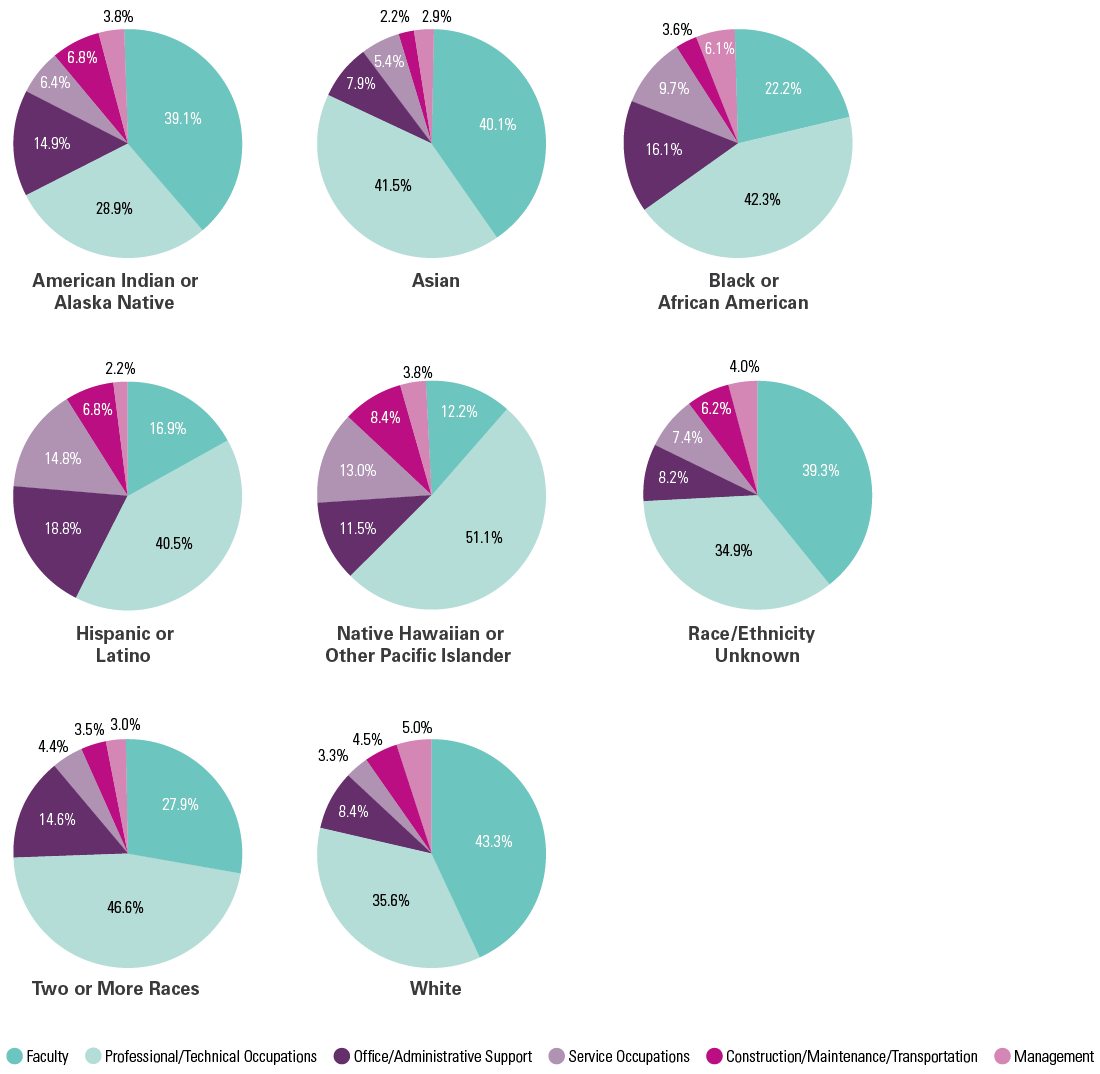
American Indian or Alaska Native
| 39.1% | 28.9%
| 14.9%
| 6.4% | 6.8% | 3.8% |
Asian
| 40.1%
| 41.5%
| 7.9% | 5.4%
| 2.2% | 2.9%
|
Black or African American
| 22.2% | 42.3%
| 16.1%
| 9.7% | 3.6% | 6.1% |
Hispanic or Latino
| 16.9%
| 40.5% | 18.8% | 14.8% | 6.8% | 2.2% |
Native Hawaiian or Other Pacific Islander
| 12.2%
| 51.1% | 11.5%
| 13.0% | 8.4% | 3.8% |
Race/Ethnicity Unknown
| 39.3%
| 34.9% | 8.2% | 7.4% | 6.2% | 4.0% |
Two or More Races
| 27.9%
| 46.6% | 14.6% | 4.4% | 3.5% | 3.0% |
White
| 43.3%
| 35.6%
| 8.4%
| 3.3%
| 4.5%
| 5.0%
|
*Refer to
Technical Notes and Glossary for the definitions of the Occupational Groups; race and ethnicity are reported according to IPEDS guidelines. All who self-identify their ethnicity as Hispanic or Latino are reported as “Hispanic,” regardless of race. Non-Hispanic individuals are reported according to their race.