ETHNICITY/GENDER
| HEAD COUNT
| PERCENT
| HEAD COUNT
| PERCENT
| HEAD COUNT
| PERCENT |
|---|
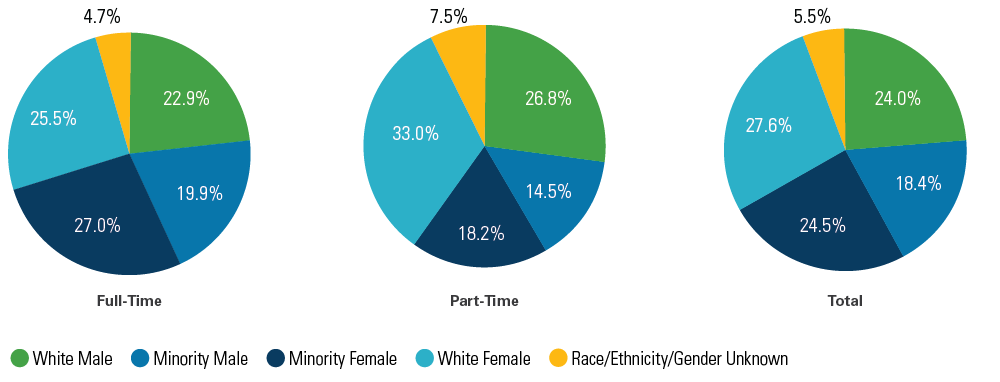
White Male
| 8,788
|
22.9% | 4,127
|
26.8% | 12,915
|
24.0% |
Minority Male
| 7,639
|
19.9% | 2,230
|
14.5% | 9,869
|
18.4% |
Minority Female
| 10,361
|
27.0% | 2,795
|
18.2% | 13,156
|
24.5% |
White Female
| 9,776
|
25.5% | 5,082
|
33.0% | 14,858
|
27.6% |
Race/Ethnicity/Gender Unknown
| 1,807
|
4.7% |
1,158 | 7.5%
|
2,965 | 5.5%
|
TOTAL
| 38,371
| 100.0%
| 15,392
| 100.0%
| 53,763
| 100.0%
|
Notes: Graph includes all employees with the exception of student employees, other intermittent or casual employees, and faculty teaching in extension, special sessions and summer sessions. A total of 26 employees identified as nonbinary, and 10 did not state gender.
"Race/Ethnicity/Gender Unknown" reflects employees who either did not indicate their race/ethnicity or did not indicate their gender (e.g., race/ethnicity is unknown, gender is unknown or both are unknown). Of these, 1,484 women and 1,455 men did not indicate their race/ethnicity.
Percentages referenced throughout report may not add up to 100% because of rounding.