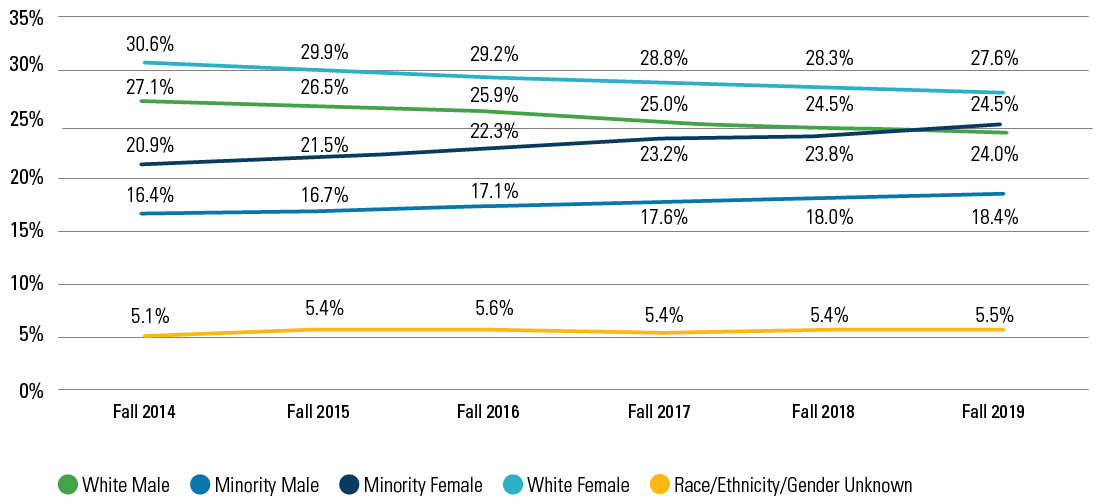
White Male
| 27.1%
| 26.5%
| 25.9%
| 25.0%
| 24.5%
| 24.0%
|
Minority Male
| 16.4%
| 16.7%
| 17.1%
| 17.6%
| 18.0%
| 18.4%
|
Minority Female
| 20.9%
| 21.5%
| 22.3%
| 23.2%
| 23.8%
| 24.5%
|
White Female
| 30.6%
| 29.9%
| 29.2%
| 28.8% | 28.3%
| 27.6%
|
Race/Ethnicity/Gender Unknown
| 5.1%
| 5.4%
| 5.6%
| 5.4%
| 5.4%
| 5.5%
|
Note: "Race/Ethnicity/Gender Unknown" reflects employees who either did not indicate their race/ethnicity or did not indicate their gender (e.g., race/ethnicity is unknown, gender is unknown or both are unknown). Of these, 1,484 women and 1,455 men did not indicate their race/ethnicity.