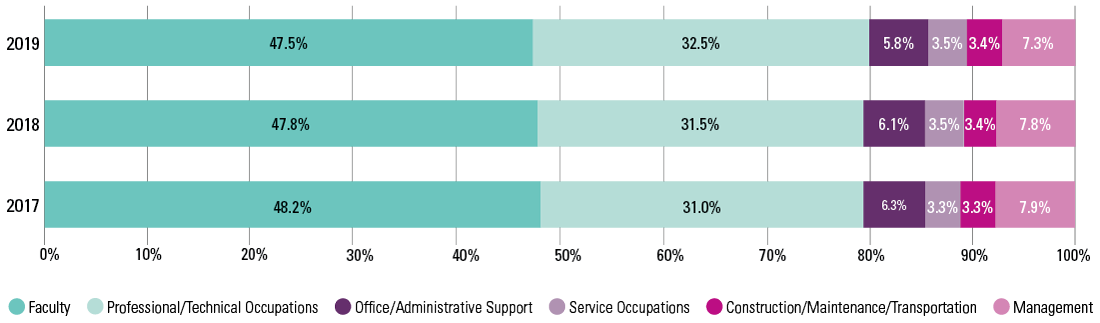
Faculty
| 48.2%
| 47.8%
| 47.5%
|
Professional/Technical Occupations
| 31.0%
| 31.5% | 32.5% |
Office/Administrative Support
| 6.3% | 6.1% | 5.8% |
Service Occupations
| 3.3%
| 3.5% | 3.5% |
| Construction/Maintenance/Transportation | 3.3%
| 3.4% | 3.4% |
| Management | 7.9%
| 7.8% | 7.3% |
*Refer to
Technical Notes and Glossary for the definitions of the Occupational Groups.