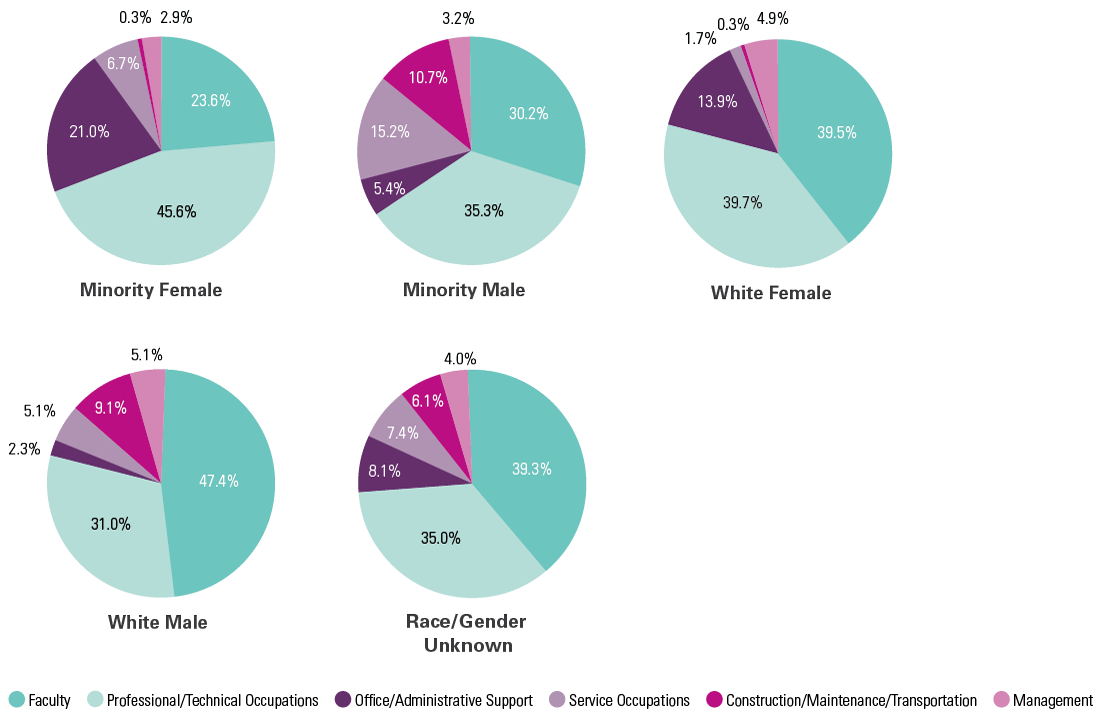
Percentage of Full-Time Employees within Gender and Race/Ethnicity, by Occupational Group
Minority Female
| 23.6%
| 45.6%
| 21.0%
| 6.7%
| 0.3%
| 2.9%
|
Minority Male
| 30.2%
| 35.3%
| 5.4%
| 15.2% | 10.7%
| 3.2%
|
White Female
| 39.5%
| 39.7%
| 13.9%
| 1.7%
| 0.3% | 4.9%
|
White Male
| 47.4%
| 31.0%
| 2.3%
| 5.1%
| 9.1%
| 5.1%
|
Race/Ethnicity/
Gender/Unknown
| 39.3% | 35.0%
| 8.1%
| 7.4% | 6.1%
| 4.0%
|
*Refer to Technical Notes and Glossary for the definitions of the Occupational Groups; "Race/Ethnicity/Gender Unknown" reflects employees who either did not indicate their race/ethnicity or did not indicate their gender (e.g., race/ethnicity is unknown, gender is unknown or both are unknown). Of these, 1,484 women and 1,455 men did not indicate their race/ethnicity.